To provide the evidence base required for the BMPs the following projects were completed in 2012/14:
- Sediment budgets for all shingle beach systems from Southampton Water to Shellness in Kent. These developed a unified methodology and sediment budget ‘heat’ maps to visualise spatio-temporal changes in beach volumes (Box 1). These were produced by Canterbury City Council.
- Run-up prediction tool for shingle beaches based on field data. The improved formula was developed by HR Wallingford.
Joint return probability data of water level and wave heights for Southeast England based on 33 year wave hindcast data. This was produced by the Channel Coast Observatory.
Sediment budget heat maps show the position along the coast on the x-axis (linked to the map at the top) and time on the y-axis. The colours reflect losses in red and gains in blue.
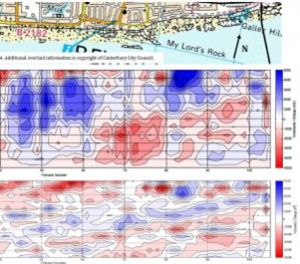
The bottom panel shows changes from one year to the next, the middle panel shows cumulative changes since the initial survey.
Each BMP started off with defining why a beach was needed in each location. Only by knowing what the Flood and Coastal Erosion Risk Management role of the beach is (for example standalone beach barrier preventing flooding of the hinterland, beach in front of an aged seawall to protect damage to the structure or beach in front of functioning structure to prevent erosion of the toe of this structure) can its size be determined. In addition, an evaluation of the amenity value of the beaches was carried out, but was not included in the assessment of beach size requirements.
Five Regional Beach Management Plans were produced covering the coast between Selsey Bill and Brighton Marina (2 parts), Eastbourne to River Rother, Kingsdown to River Stour and Minnis Bay to Graveney. BMPs follow the same template and assessment criteria which allows for the direct comparison of risk for shingle beaches around the Southeast. The BMPs contain extensive appendices to make them a ‘one-stop-shop’ for information to inform beach management including defence schematics. All GIS files, spreadsheets and tools used are available satisfying the criteria of being fully accountable and transparent.
Using the data produced in 2012/14, the project developed a methodology and visualisation combining beach size, joint return probabilities and overtopping rates (Box 2) that will form part of the CIRIA Beach Management Manual addendum (to be published in late 2017) on beach trigger levels.
Overtopping assessment on beach size
Using the joint probability data (return periods as coloured lines) in an iterative process with EurOtop, the impact of beach size (cross sectional area on the x-axis) on the overtopping rate (y-axis) can be assessed.
Adding to the graph the highest, lowest and present cross sectional area (vertical lines) from coastal monitoring surveys makes the Standard of Protection immediately visible and also allows an estimation of change to the Standard of Defence in case beach levels (expressed as cross sectional areas) drop.
All data on the present risk is then condensed into one graph that provides immediate feedback to the beach manager in relation to the health of the beach (Box 3). These synthesis graphs will be updated through the coastal monitoring programme when new survey data (the pink bar) becomes available.
Beach management synthesis
The graph shows data for all coastal monitoring profiles using ‘box and whiskers’ where the ‘whiskers’ represent the maximum and minimum cross sectional areas (scale on the left hand side is in m2) since the monitoring programme started and the pink ‘box’ shows the latest survey results.
The light and dark blue alternating line at the bottom of the graph corresponds to the coloured sections in the aerial photograph at the top providing the spatial reference. These coloured sections indicate different defence sections.
The coloured bands relate to beach cross sectional area required to provide a Standard of Protection against flooding of 1:200. This Standard of Protection relates to the acceptable rate of overtopping for the location depending on what lies behind the defences. The cross sectional areas vary for each defence section depending on for example the presence (sections G and H) or absence (section F) of a rear splash wall or the presence of a rock revetment (section J) which does not require a beach to provide overtopping protection.
The 1:200 year beach requirement is at the transition between the Maintenance and Critical Range and the width of these ranges depends on the volatility of the beach based on the present maintenance regime.
In this example the only profile that appears to have a borderline 1:200 level of protection and has in the past fallen below that level is at the western end of section G. This profile includes a Lido that protrudes from the general shoreline and thus the profile does not represent the whole beach as it extends below the Lido. This shows that some interpretation and familiarity with the site is still required to make sense of the data
The project also explored options for moving beach material over longer distances using a vessel, however, as the BMPs did not identify large enough quantities that required moving to fill an updrift deficit area, none of the possible movement options (e.g. flat top barges or side tipping rock barges) was trialled. It is anticipated that if and when the requirement for recycling over larger distances arises, transport using a vessel will be considered.
Impact on current beach management
Major results of this work are that,
- the standard of protection along all BMP frontages is at or above the level required for the risk identified, apart from some very local spots (usually where a hard defence is projecting seaward beyond the general coastal alignment beach alignment, mainly maintaining a historical misalignment);
- beach material is accumulating in several locations against longshore transport obstacles at the downdrift end of a cell from where it could potentially be transported to updrift locations or extracted to generate funds to place new material at updrift locations;
- beach redistribution should be the default option rather than importing new material.